
You can run sharp interviews, check every reference, and still land the hire who no-shows in week three or quietly normalizes a skipped safety step by month four. At one or two roles, that is an unlucky outcome. At a hundred roles a quarter, it becomes a pattern you can see in the numbers: higher turnover, more incident reports, and workers’ compensation claims that follow short-tenured, poorly matched hires.
That pattern is the real subject of this honesty integrity test guide for HR hiring success. The point is not to define the test one more time, but to connect it to the outcomes leadership actually measures, retention, safety, and loss, and to show how a validated integrity screen earns its place as a financial and risk-management tool rather than a routine formality. Treat the score as a defensible, measurable selection control, not a lie detector, and the returns show up where finance already looks.
What “Hiring Success” Looks Like Beyond the First 90 Days
For high-volume HR, a successful hire is not the one who interviews well. It is the one who is still on the schedule, still following the safety routine, and still trustworthy with inventory at month twelve. That reframing matters, because most of the cost of a bad hire arrives late: it surfaces as the attendance slide, the ignored procedure, and the shrink that only appears at inventory count.
The expense compounds quietly. A separation inside the first year means you absorb the recruiting and onboarding cost twice, lose the productivity of a role that is empty or under-trained, and often pay the overtime that covers the gap.
To put a number on the safety side alone, the Liberty Mutual Workplace Safety Index (2025) estimates that the most serious workplace injuries cost US employers about $58.78 billion a year, with overexertion alone accounting for $13.7 billion. An integrity test will not erase that, but it shifts the base rate toward people who keep doing the right thing under pressure and with little supervision. So define success up front in terms you can monitor: first-year retention, incident and injury rates, and loss events for the roles where one preventable decision becomes a measurable cost. Then hold the test to those outcomes rather than to vendor promises.
The Retention Payoff
Turnover is often a behavioral signal, not just a pay or scheduling problem. A share of early departures trace to a weak fit between the person and the accountability the role demands, the same misalignment that later shows up as missed shifts and ignored procedures. Screening for integrity-related traits, dependability, rule adherence, and follow-through, tilts your hiring toward people whose everyday choices predict that they will stay and perform. Our analysis of how honesty tests reduce employee turnover walks through how screening out the riskiest slice of applicants translates into double-digit retention gains in high-volume roles.
That retention effect is also where the financial story begins, because tenure and safety move together. The peer-reviewed study by Cooper, Slaughter, and Gilliland in the Journal of Business and Psychology (2020) identified a clear mechanism: higher overt integrity scores predicted stronger motivation to work safely and better compliance with safety rules, along with lower rates of malingering. Reliable people stay longer and get hurt less, and across a full year those two effects reinforce each other, fewer exits to backfill, and fewer claims to absorb.
The Workers’ Comp Connection
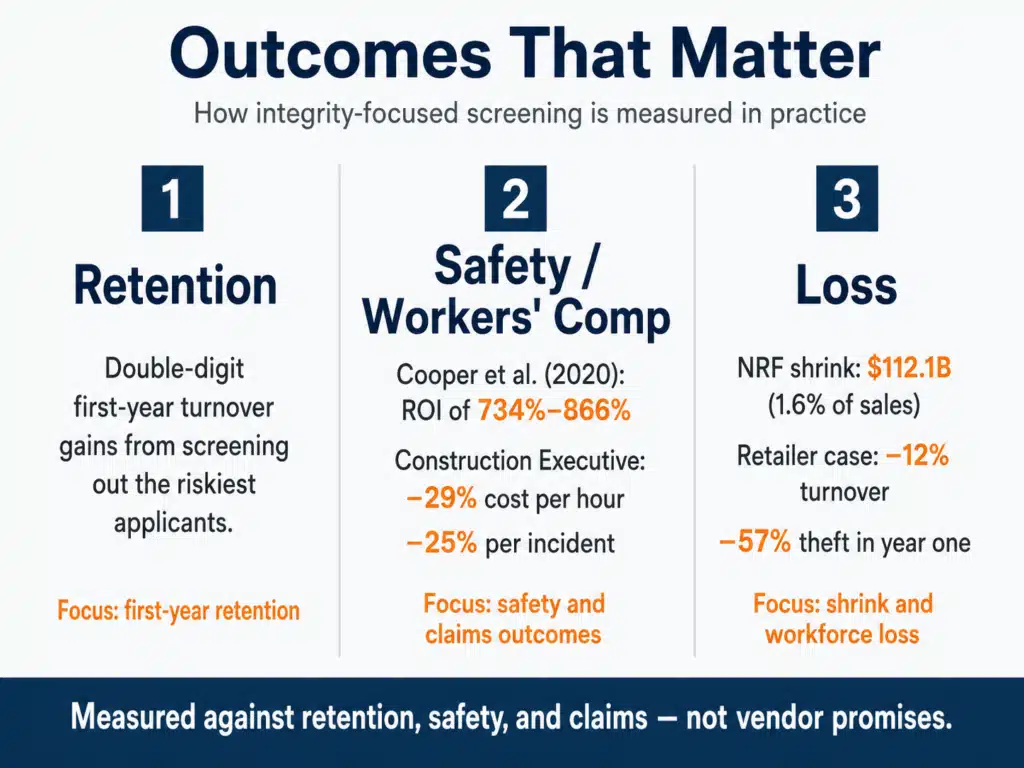
This is where the outcomes case becomes concrete, and it is the differentiator most definitional articles skip. In the same study, Cooper and colleagues (2020) analyzed archival data from three organizations and found that screening applicants with an overt integrity test reduced workers’ compensation claim rates and the costs attached to them, with a return on investment of 734 percent in one sample and 866 percent in another. The savings arrived from two directions at once: fewer genuine injuries among safety-minded hires, and less malingering, the exaggeration or fabrication of claims for personal gain.
Industry data points the same way. According to Construction Executive, pre-employment screening that includes integrity testing has been associated with workers’ compensation costs falling by 29 percent per hour worked and 25 percent per incident, with an estimated return of six to eighteen dollars for every dollar spent on testing. That matters beyond a single claim, because claim history feeds the experience modifier that multiplies your premiums year after year. A lower claim frequency today compounds into lower insurance costs for several years, which is why a screening step that looks like a recruiting expense often reads, on the finance side, as a safety investment.
Sector Snapshots: Where the Outcomes Land Hardest
The mechanics are universal, but the payoff concentrates in industries where short tenure and physical or financial risk meet. The specific numbers make the case better than any general claim.
Construction
High turnover and safety exposure make construction the clearest case. Crews depend on every worker following the procedure when a supervisor is on another floor, and newer workers carry a disproportionate share of injury risk, so reducing early turnover and screening out risk-prone applicants directly lowers claim frequency. That is the dynamic behind the 29 percent per-hour reduction in workers’ comp costs cited by Construction Executive, and the financial logic of fewer claims and a better experience modifier is laid out in our network’s construction recruitment guide.
Healthcare and social assistance
These sectors carry the heaviest injury burden in the country: Bureau of Labor Statistics injury data consistently show health care and social assistance reporting more nonfatal workplace injuries and illnesses than any other private industry, driven by occupations like nursing assistants. The cost of an unreliable hire here reaches past dollars to patient safety and documentation integrity, so screening for dependability before the offer is a front-line defense. Our breakdown of risky hires and workers’ comp claims traces how avoidable claims often start with the hire.
Retail
Here the dominant losses are shrink and churn, and they feed each other, since high turnover means more new and unmonitored employees handling cash and inventory. The scale is striking: the NRF National Retail Security Survey reported retail shrink of $112.1 billion in 2022, about 1.6 percent of sales, with employee theft a significant slice of the total. Against that backdrop, our case data in the ROI of honesty tests in hiring documents a national retailer that saw a 12% drop in turnover and a 57 percent reduction in employee theft within the first year of integrity screening.
Honesty Integrity Test Guide for HR Hiring Success: Turning a Screen Into a Strategy

A test only produces these outcomes when it is used with discipline, so this is the part of the honesty integrity test guide for HR hiring success that turns evidence into a program. Four practices separate a strategic screen from a checkbox:
- Validate for the job. Choose an assessment that is job-related and supported by validity evidence for outcomes like yours, so the step holds up under UGESP scrutiny if it is ever challenged.
- Combine, do not replace. The strongest results come when the integrity score sits alongside a structured interview and reference checks, each carrying a distinct, job-relevant question, rather than acting as a sole filter.
- Use bands, not a single cutoff. Group scores into ranges so a lower band triggers a structured follow-up conversation instead of an automatic rejection, which preserves both fairness and defensibility.
- Monitor the outcomes. Track retention, incidents, and claims by score band over time, and adjust as roles change. The deeper deployment mechanics live in our companion guides on the ROI of honesty tests in hiring and the ROI of an integrity self-assessment for HR.
The Metrics That Prove It Worked
Hiring success is a claim you should be able to support with numbers, so decide before launch which ones you will watch. A practical scorecard for an integrity program tracks the outcomes that connect screening to the budget:
- First-year and 30/60/90-day turnover, compared across score bands and against your pre-program baseline.
- Workers’ compensation claim frequency and severity, plus your experience modifier, since both feed premiums directly.
- OSHA-recordable incidents and near-miss reporting in safety-sensitive roles.
- Shrink and policy-violation separations, especially in retail and cash- or inventory-handling roles.
- Selection rates by protected group, monitored with the four-fifths comparison to catch adverse impact early.
Run a clean before-and-after or screened-versus-unscreened comparison, and give it at least two or three quarters, since the strongest effects, retention and claim frequency, take time to appear. If those numbers move in the right direction, you have evidence of hiring success that finance and legal will both accept, a far stronger position than a single vendor statistic.
Make Integrity Screening a Retention and Safety Strategy
Used well, an integrity test stops being a screening filter and becomes a lever on the outcomes that define a healthy workforce: people who stay, work safely, and protect the margin. IntegrityFirst Tests helps US HR teams in construction, healthcare, and retail match the right format to each role, set decision rules that hold up, and measure the retention, safety, and claims results that justify the program. Talk with IntegrityFirst Tests to build a screen aimed at hiring success, not just screening volume.


")


